Thursday, September 02, 2010

Beyond belief – denial, scepticism and all the rest

There’s a thoughtful discussion of belief versus rationalism, as it applies to climate science, over at Climate Spectator.

Climate Spectator is a website “that will seek to cover not just the science and politics of climate change, but also the key business parameters: the massive flows of investment expected in coming years and decades, the changing business models, the new technology, and the creation of new markets and investment propositions.”

In his article Beyond belief Paul Gilding starts off:

It’s time for true confessions. I don’t believe in climate science.

That’s because I’m a rational person. Belief is important in my life and I apply the term to things involving faith. Faith is how we believe when there is no rational basis for a decision. Faith and belief often apply to matters of the spiritual realm. But they also apply to matters of a more worldly nature, where the capacity for faith and belief has framed many positive developments in humanity over history.

There are quite a few interesting points made by Paul and the people who commented on his post, so don’t delay, go read it now!

Saturday, April 10, 2010

The rattlesnake’s rattle – Part 2

My previous article Climate change – debating the rattlesnake’s rattle (posted on 23 March 2010) invited readers to think about the very basics of scientific procedure: questioning, measurement, interpretation, hypothesizing, and all the rest of it.

At the end of that article, I included the following image:

rattlesnake
Imagine that the snake represents climate changes
going way back in time, and we’re positioned
at the very tip of the rattle

Readers may not have understood what I was trying to get at, so here’s some more about my intention in introducing the snake analogy.

Firstly, a rattlesnake has a nasty bite! So I’m a little concerned that – whatever “wrong” might signify -- asking the wrong questions, taking or focussing on the wrong measurements, making the wrong interpretations, presenting the maze of information in the wrong ways, will all lead to wrong conclusions and wrong actions being taken (at great effort and expense for us all).

When searching for a rattlesnake image, I was thinking about the rather snakelike, wavy shape of the global temperature fluctuation graph over a very long time scale. I should have included such a chart in that article, but time ran out on me.

Take a look at the Wikipedia article Geologic temperature record and click on each of the thumbnail charts to view larger versions. Think hard!

Here’s one rattlesnake, and what I’ve called its “rattle area” I’ve circled in green. It shows “the long-term evolution of oxygen isotope ratios during the Phanerozoic eon as measured in fossils” (I’m sure you all immediately understand what that means):
 View of climate change extending back through the last 540 million years, including many cycles of change from warm to cold and back again.
View of climate change extending back through the last 540 million years, including many cycles of change from warm to cold and back again.

Hmm, I’m not at all sure if I’m interpreting this correctly! But it seems to be saying that around 450 million years ago (circled in pink) it was even colder than now. And it was certainly far hotter around 70 million years ago (circled in red), even hotter around 270 million years ago (and pretty hot around 360 and 480 million years ago).

Maybe the phanerozoic chart above is not saying that at all, is it? I might be classified as a “trained scientist” but am in no way a climate change specialist, so my interpretation could be way off beam. Exactly what is the above chart telling us?

Then there’s this 65 millions year of climate change chart, obtained :

 Expansion showing climate change during the last 65 million years. Note that the scales are not numerically the same since they are based on measurement different types of taxa under different conditions. Expansion showing climate change during the last 65 million years. Note that the scales are not numerically the same since they are based on measurement different types of taxa under different conditions.

My “rattle area” this time is circled in pink. Somewhere in that condensed area of the chart is the last few hundred years of climate change.

Hmmm, again. Benthitic Oxygen-18 measurements, changes in chart scaling factors, polar ocean equivalents – but it sure looks impressive!

To me, from this 65 million years chart it’s hard to interpret whether current temperature changes that are filling the headlines are of much significance compared with changes in the last million years or so. Specialists in this field please explain, exactly what does this second chart tell us?

So, sitting on the fence and feeling very uncomfortable,  I leave it there for you all to ponder! … Time has run out for me again.

Tuesday, March 23, 2010

Climate change – debating the rattlesnake’s rattle

My aim with this Basic Questions blog is to encourage people to think “scientifically” and to ask the “right” questions. If you don’t ask the “right questions” then you can’t hope to come up with meaningful, dependable answers.

This applies to all walks of life. There are some issues such as the debate on AGW (anthropogenic global warming) where confusion and misinformation abounds, as highlighted for example by a recent post of mine A little bit of Carbon Dioxide? (the claim that only 3.4% of carbon dioxide, which is only 3.62% of greenhouse gases,  is caused by human activity).

Let’s look at another claim by Burt Rutan (referring again to his PDF and this PowerPoint presentations). At slide 16 of the latter, he talks about dishonest presentation of information, such as the now famous (or perhaps infamous) “hockey stick” claims about global warming:

image

And at slide 16 he decries what he says is “data manipulation” – the apparent sleight-of-hand in doing away with the medieval warm period -- by the United Nation’s intergovernmental panel on climate change (IPCC):

image

And so on. There are so very many presentations available that you are likely to lose your way in the overabundance of pretty charts and different data “interpretations” or whatever you want to call them.

Apart from Rutan’s, and as just one other example, try battling your way through some of the presentations by The Global Carbon Project (GCP) such as The Carbon Budget 2007+ presented at CLIMATE CHANGE - Global Risks, Challenges & Decisions (Copenhagen, 10-12 March 2009).

UPDATE: Bill McKibben of 350.org says in Dissecting the sceptics (2) that "Very few people really want to change in any meaningful way, and given half a chance to think they don’t need to, they’ll take it" and “at bottom, that’s a battle as much about courage and hope as about data.”

Who’s “right” and who’s “wrong” about all this complicated stuff, if it can be put so simplistically? There’s dissension among even the climate science specialists, so how can non-specialists make sense of it all and come to logical conclusions about what can be done (if anything) to modify the climate changes?

There’s little doubt that there has been some warming during the last several decades, but my question this time is:

How significant is the present global warming trend in the very-long-term picture of global climate change?

What I’m getting at here is, if we try to estimate what has happened to the climate going back not just a few hundred years (such as the medieval period), but many thousands and even many millions of years, then what picture emerges (and how reliable is it)? It has been a lot hotter at times long ago (such as when there were green forests in what we now call Antarctica), as well as much colder during various ices ages.

Are the current temperature fluctuations, in comparison with with the totality of changes over the eons, like just the rattle on the rattlesnake’s tail?

rattlesnake
Imagine that the snake represents climate changes
going way back in time, and we’re positioned
at the very tip of the rattle

Are we focussing too much on the rattle, warning sign though it is, rather than on the picture that emerges if we stand right back and look over the entire rattlesnake?

Is the tiny part of the historical global temperature graph just a “pimple on a pumpkin” and nothing more than a tiny squiggle at the very end of a curve that has had many ups and downs, some of them perhaps much larger than current variations?

I’m not sure, are you? What can and should we do, if anything, to avoid the rattlesnake’s bite?

Sunday, March 21, 2010

The universe is 20 million years older than previously thought

Thanks to my friend William Atkins for pointing out at iTWire that astrophysicists from Princeton and Johns Hopkins universities have determined the age of the universe more precisely, and it turns out to be a “little” older than previously thought.

The scientists have analyzed data from WMAP, NASA’s Wilkinson Microwave Anisotropy Probe, and have come up with an additional 20 million years.

WMAP definitively determined the age of the universe to be 13.73 billion years old to within 1% (0.12 billion years) -as recognized in the Guinness Book of World Records! So a mere 20 million years can be considered just a tiny amendment of the universe’s age!

This Basic Questions blog has a number of earlier posts about such cosmological matters. If you’re at all interested in cosmology, the WMAP site should definitely be on your must-see list. Since 2000, they say, the three most highly cited papers in all of physics and astronomy are WMAP scientific papers.

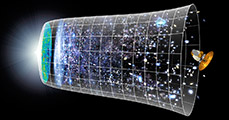
A visual Timeline of the Universe
Timeline of the Universe

Saturday, March 20, 2010

Noxious chemical alert – global environmental threat!

It may not be widely realized, but this chemical substance is in heavy use and can be measured in very significant concentrations in our rivers and lakes.

It is also present in all sorts of commercial products including pesticides, is found inside most nuclear reactors, and is used in many other situations which would give any right-minded environmentalist reason to worry.

Please, please, please watch this video and become aware of the global threat to our rivers, oceans and atmosphere.

Show your understanding and support by commenting below. Even Albert Einstein (pictured below?) might sign a petition to ban it. Would you?

Do you see what I mean? Don’t be fooled, stand back and consider it carefully.

As a one-time chemistry teacher -- and putting aside any false modesty due to the serious nature of the environmental threat -– trust me, I’m an expert having considerable knowledge about this pervasive substance.

Monday, March 08, 2010

A little bit of Carbon Dioxide?

I;ve been following a lot of blogs, web sites, popular press stories and other sources of information concerning climate change, global warming and cooling, supposed causes and effects, and am appalled by the enormous proportion of them that involve non-scientific thought.

Here’s today’s basic question.

Is engineer Burt Rutan exhibiting correct (realistic, logical) thinking and analysis when he applies his analytical skills outside his field of aeronautics and plunges into the battlefield of debate about anthropogenic global warming (AGW)?

Take a look at his reasons for studying AGW, and some of the conclusions he has reached, in this PDF and this PowerPoint presentation.

Here’s a tiny taste of his writings on this topic. With slide 8 of the PowerPoint set he casts serious doubt about the effectiveness of any attempt to curb human-caused CO2 emissions on global warming:

image

His notes for slide 8 say:

Introducing the AGW scare requires only a look at Greenhouse Gasses. The big block of 100 squares represents all the greenhouse gasses which are dominated by water vapor. The Yellow is CO2 that comes from natural sources (other than Man). The little Red block is CO2 from Human emissions. Stare at this chart while you ask yourself; Why would the economies of the US and the world be threatened by this much of the greenhouse gas, even if the greenhouse were the only driver of planet warming?? It is not, and we will later see what actually controls the planet temperature. There is an enormous push now to reduce the red block by a few % by 2020 - a difficult, expensive goal that will have a nil effect on planet temperature.

The fact that this is so clear reveals that those pushing the hardest and those controlling the funds for research worry little and care little about warming or flooding. If they did, they would not grossly emit carbon and buy homes at Sea Level in West Palm Beach, Florida.

There’s a lot else to ponder in this presentation. For example, in slides 24 and 25 he looks into atmospheric temperature variations over the last 410,000 years (as indicated by Vostok ice cores), and says:

“Is hot or cold bad?? The Alarmist warns that a third of Florida could again be flooded like it was many years ago. However, most of North America and Europe have had a mile-thick ice sheet, most of the time.

Therefore, if you have a of crisis, is it the rescue of those in Disney World or the need for everyone move to Panama/Sahara to keep from freezing?

… The planet preference is the ice age, where the fossil record shows extinction preference”

So my question is, what would you prefer? Examine Rutan’s entire presentation and let me know what you think!

Saturday, February 06, 2010

Proof of global warming ... Means exactly what?

This blog is all about aking basic questions and attempting to answer them "scientifically" which is to say that it stands for logical, clear thinking, of which there is a dearth.

I wrote a post several years ago about the science of climate forcing, and since then the topic of climate change has come to the boil. I'd say that my position in the great climate debate is that of an agnostic, a fence-sitter if you like.

Here's a basic question for you to comment on here, but please note that it  must be answered in a cool and scientific fashion -- or else I might exercise my prerogative (as owner of this blog) and delete your posts, since I intensely dislike abusiveness, sloppy thinking, misquoting, and all such negativism.

THE BASIC QUESTION IS ...
Regarding GCC (global climate change) or if you like AGW (anthropogenic global warming), and NOT being concerned with localized weather changes -- and apart from any disagreements about whether the climate actually is warming or cooling, but supposing that it IS warming:
Does proof of global warming amount to proof of man made warming? Is it being unscientific and illogical to claim that it does?
There are some subsidiary basic questions, too, such as: Is it all too big for us to stop, anyway? Doubtless your answers will bring up matters like this!

Saturday, January 02, 2010

Cogitating carbon cycle conundrums

I haven’t posted much in this blog for a while, but that’s not to say that I haven’t been pondering lots of different things: cosmology, basic physics, chemistry (my career before getting into information technology forty years ago), evolution, and more.

There has been a lot of controversy for the last decade about climate change, and I’ve written a few posts on this topic. The just-concluded massive United Nations Climate Change Conference in Copenhagen (COP15) may, or may not, lead to significant outcomes, depending on how various countries act (especially those with large populations).

Opinions differ widely about what is happening to the climate – from the doomsayers to the sceptics – and my own position is somewhat ambivalent.

Down here in Australia, with its relatively small population (not too much over 20 million), whatever we do won’t have much effect on the world’s climate. We produce  heavy carbon dioxide outputs per capita, but this amounts only to a tiny fraction of the overall global CO2 output.

Some of us fear that federal climate change legislation in the offing will lead to savage increases in the cost of electrical power and an uncompetitive economy. What’s a balanced position for us to adopt: go easy on the legislation and suffer the climate consequences (causing only a small part of the global effect), or aim for high CO2 reductions that will cost us the proverbial arm and leg?

In this blog about “basic questions” one of the key discussion points should be about the science of climate change, rather than the politics and the economics.

So I’m still reading as much as I can find time for about anything and everything related to climate change. One very pertinent article that I’ve stumbled upon just recently is Carbon cycle conundrums in which David Schimel asks “What will control future rates of climate change?”

The carbon cycle is the largest contributor to anthropogenic climate change, yet despite decades of research significant mysteries about its behavior remain. Global analyses show that the Earth system absorbs approximately half of anthropogenic fossil fuel emissions. This uptake is partitioned between absorption by the oceans and storage in terrestrial ecosystems. Uptake by the Earth system reduces the climate effects of emitted CO2 to approximately half of what would occur without sinks. …

The reduction over time of the efficiency of the sinks is of great concern because it implies a weakening in the ability of the Earth system to mitigate the effects of fossil fuel emissions and a potential positive feedback that may strengthen in the future.

And later, under Key Questions:

Although we have learned a great deal about the carbon cycle, the scientific community is still limited in its ability to make confident predictions about the likely response of the carbon cycle to global environmental change. … Getting global phenomena right, like the observed change in the airborne fraction, is critical for testing models. Purely local or process-level validation is not enough because of the great variety of local responses.

And there’s more, please read it yourself. But as one with some science training, I appreciate the honesty and transparency – far from universally acknowledged in the climate debate -- that there are unknowns and that further research is needed!